
The Challenges and Gaps in Agile Project Management: A Study in I.T. Project Consultant Companies
A dissertation findings and discussion chapter on the challenges and gaps in agile project management at IT project consultancies. It reports a questionnaire of IT professionals analysed in SPSS, with descriptive statistics, correlation, covariance and linear regression, then links the results back to five research questions and closes with recommendations and appendices.
This is the findings and discussion chapter of a dissertation on agile project management in IT consultancies, written as a sample for computer science and project management modules. It reports a questionnaire of IT professionals analysed in SPSS: descriptive statistics, Pearson correlation, covariance and univariate analysis of variance, and a linear regression with its ANOVA table. The SPSS output for each test is reproduced beside it or in the appendices, as a marker would expect.
If you are writing something similar, our computer science assignment help page explains how we handle quantitative chapters, and the computer science assignment samples archive has more. For the chapters either side of this one, see our computer science dissertation sample and our example of a research proposal.
1. Introduction
This chapter reports and interprets the primary data collected for the study. Agile project management is an iterative approach to delivering a project throughout its life cycle, and iterative approaches are frequently used in software development (Association for Project Management, n.d.). This research asks a narrower question about it: which challenges and gaps appear when IT project consultancies run agile teams in practice. The study used a mixed design. A questionnaire collected quantitative responses from practitioners, and the open answers to those questions supplied the qualitative material. The quantitative responses were coded and analysed in SPSS, and the output of those tests is reproduced here in full.
The questionnaire was distributed to IT project consultancy firms that use agile methods in their delivery work, and it was built around the five research questions listed in section 4.2. The analysis runs in three stages: a descriptive profile of the respondents and their projects, a correlation analysis between project clarity, backlog quality, task difficulty and the level of challenge reported, and a regression that tests whether meeting effectiveness and customer satisfaction predict that challenge level. Covariance output is reported in the appendices. The sample as a whole is 124 questionnaire responses; fewer cases enter each test, and the number used is stated with the test.
What Are the Main Challenges in Agile Project Management?
Practitioners at the IT consultancies in this study describe budget pressure, communication gaps within the team and between the team and its leader, impractical deadlines, unclear or missing objectives, scope creep and conflict between team members. Almost every open answer is worded differently, so these are recurring themes rather than ranked counts; twelve respondents left the question blank.
The published reviews point the same way. Marnada and colleagues review the scope-and-change problem across the published studies and find communication and coordination among its most significant sources (Procedia Computer Science, 2022). Kalenda, Hyna and Rossi add what happens when agile is scaled across a large software company: resistance to change, an overly aggressive roll-out, quality assurance concerns, and fitting agile into business processes that are not agile (Journal of Software: Evolution and Process, 2018). Both are in the reference list below.
2. Primary Analysis
Descriptive Analysis
The descriptive analysis covers 124 questionnaire responses from IT professionals working in or managing agile teams. The first question asked when work on a project actually starts. The most common answer was that it begins once both the project timeline and resource availability are settled: 41 respondents, or 33.1 per cent. Thirty respondents (24.2 per cent) said work starts as soon as the agreement is signed, 18 (14.5 per cent) only after the requirements and the plan are ready, and 15 (12.1 per cent) on resource availability alone. Twenty responses, 16.1 per cent of the total, carry no label in the exported table and are treated here as missing. The full frequency distribution is below.
When work on an agile project starts, 124 questionnaire responses
Chart data
| Item | Value (responses) |
|---|---|
| Once timeline and resources are settled | 41 responses |
| As soon as the agreement is signed | 30 responses |
| After requirements and plan are ready | 18 responses |
| On resource availability alone | 15 responses |
| No label in the SPSS table | 20 responses |
|
Project initiation | |||||
|
Frequency |
Percent |
Valid Percent |
Cumulative Percent | ||
|
Valid |
20 |
16.1 |
16.1 |
16.1 | |
|
Based on resource availability |
15 |
12.1 |
12.1 |
28.2 | |
|
Based on the project timeline and resource availability |
41 |
33.1 |
33.1 |
61.3 | |
|
Immediately as the agreement is signed |
30 |
24.2 |
24.2 |
85.5 | |
|
Only after project requirement and plan is ready |
18 |
14.5 |
14.5 |
100.0 | |
|
Total |
124 |
100.0 |
100.0 | ||
Table 1: Agile project initiation
(Source: SPSS)
The rest of the descriptive analysis profiles the respondents and their projects: the type of company they work for, their role in the team, the average size of that team, their experience, how often they meet the client, how satisfied they are with the team and the job, and how difficult they find the tasks assigned to them. Each is reported below from the SPSS output.
Respondents were drawn from all three company types, with product companies the largest group at 41.94 per cent of the 124 responses, project companies next at 39.52 per cent and hybrid companies at 8.06 per cent. The remaining tenth are blank or hold answers that belong to other questions, a data-entry problem that recurs in the role, team size, experience and meeting questions. The split matters for the rest of the analysis, because a product company and a project consultancy meet different versions of the same agile problem: one manages a backlog it owns, the other manages a backlog a client owns.
On role in the team, the largest single group is the questionnaire's combined Scrum master or product owner category at 36.29 per cent, followed by project managers at 23.39 per cent and team leads at 9.68 per cent. Directors or board members (7.26 per cent), developers (5.65), business analysts (4.84) and quality analysts (2.42) make up most of the rest. The sample is therefore weighted towards the people who run agile ceremonies rather than the people who write the code, which is worth remembering when reading the answers on leadership and communication.
Average team size clusters between three and twenty members. Of the 124 responses, 30.65 per cent report teams of five to ten members, 26.61 per cent teams of three to five, and 25.00 per cent teams of ten to twenty; the SPSS output labels these three ranges "10-May", "5-Mar" and "20-Oct" because a spreadsheet converted them to dates before the data reached SPSS. Only 5.65 per cent reported teams larger than twenty.
Experience is spread widely across the sample. The largest bands are ten to fifteen years of experience in IT team management (19.35 per cent), seven to ten years (17.74 per cent) and five to seven years (16.94 per cent), and about two thirds of respondents report seven years or more. The answers therefore come from practitioners who have worked through the transition to agile methods rather than only from people who have known nothing else.
On the frequency of client meetings, 41.94 per cent of respondents meet the client once a fortnight, 21.77 per cent daily, 13.71 per cent only at the end of each milestone and 12.10 per cent weekly. The spread is itself a finding: a fortnightly or milestone-based client rhythm sits awkwardly with a framework built around short iterations and continuous feedback.
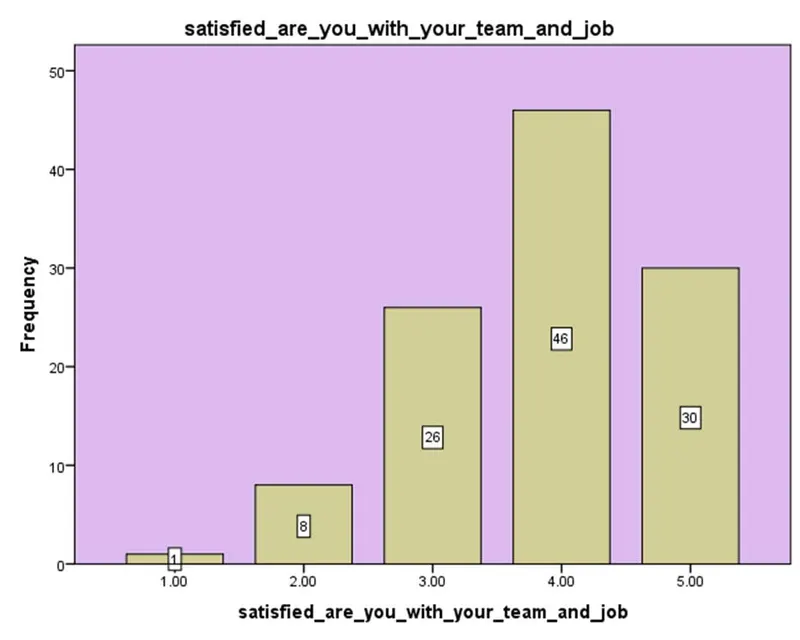
Figure 1: Satisfaction level of agile team
(Source: SPSS)
Satisfaction with the team and the job was measured on a five-point scale, and 111 respondents answered. Forty-six chose level 4 and 30 chose level 5, so 76 of the 111, about 68 per cent, sit in the top two bands; only nine chose level 1 or 2.
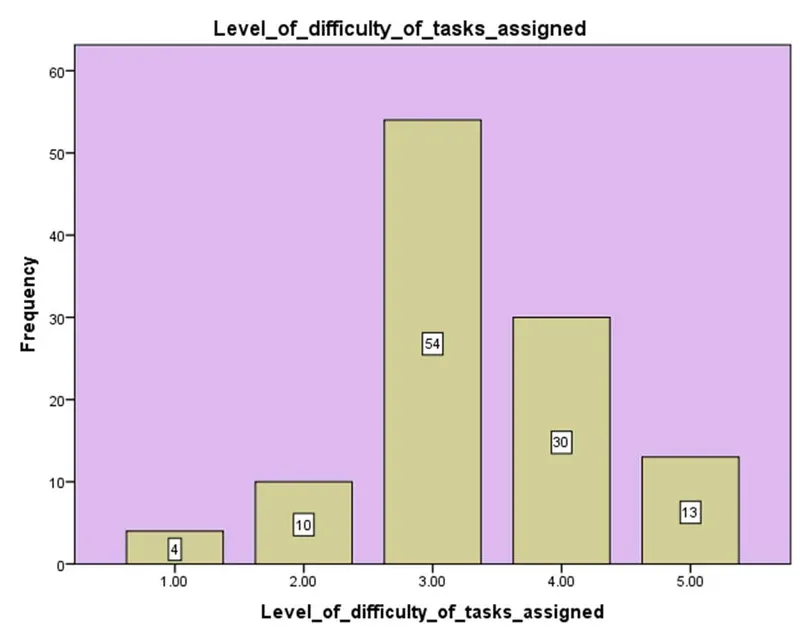
Figure 2: Difficulty level of tasks
(Source: SPSS)
On the difficulty of the tasks assigned to them, 54 of the 111 respondents chose level 3 on the five-point scale, 30 chose level 4 and 13 chose level 5, so 97 of them place their work at or above the mid-point of the scale. Read with the satisfaction figures above, the sample describes work that is demanding and teams that are nonetheless content, which is the tension the discussion section returns to.
Correlation Analysis
The second stage of the analysis tests whether four variables move together: clarity of the project objectives, elaboration of the product backlog, difficulty of the tasks assigned, and the level of challenge in the project. Pearson correlation coefficients and two-tailed significance values are reported in the table below, which SPSS ran on 111 valid cases.
|
Correlations | |||||
|
Clarity_of_objectives_of_the_project |
Product_backlog_elaboration |
Level_of_difficulty_of_tasks_assigned |
Level_of_challenge_of_the_project | ||
|
Clarity_of_objectives_of_the_project |
Pearson Correlation |
1 |
.225* |
.234* |
.413** |
|
Sig. (2-tailed) |
.017 |
.013 |
.000 | ||
|
N |
111 |
111 |
111 |
111 | |
|
Product_backlog_elaboration |
Pearson Correlation |
.225* |
1 |
.259** |
.201* |
|
Sig. (2-tailed) |
.017 |
.006 |
.035 | ||
|
N |
111 |
111 |
111 |
111 | |
|
Level_of_difficulty_of_tasks_assigned |
Pearson Correlation |
.234* |
.259** |
1 |
.263** |
|
Sig. (2-tailed) |
.013 |
.006 |
.005 | ||
|
N |
111 |
111 |
111 |
111 | |
|
Level_of_challenge_of_the_project |
Pearson Correlation |
.413** |
.201* |
.263** |
1 |
|
Sig. (2-tailed) |
.000 |
.035 |
.005 | ||
|
N |
111 |
111 |
111 |
111 | |
Table 2: Correlation analysis
(Source: SPSS)
The table reports six pairwise correlations, all positive and all statistically significant at the 0.05 level. The strongest is between clarity of objectives and the level of challenge of the project (r = .413, p < .001). The rest are weaker: task difficulty with the level of challenge (r = .263, p = .005), backlog elaboration with task difficulty (r = .259, p = .006), clarity with task difficulty (r = .234, p = .013), clarity with backlog elaboration (r = .225, p = .017), and backlog elaboration with the level of challenge (r = .201, p = .035).
Two points follow, and they are easy to overstate. First, the coefficients are weak to moderate in size, not strong: the largest of them, .413, corresponds to about 17 per cent of shared variance, so most of the variation in reported challenge is explained by something not measured here. Second, because every two-tailed significance value is below .05, each of these relationships is unlikely to be a product of sampling alone. Statistical significance and practical size are separate questions, and this output answers only the first. What the pattern does suggest is that the variables a team can control, how clearly objectives are stated and how well the backlog is elaborated, are associated with how challenging the project turns out to be.
A univariate analysis of variance was then run, with satisfaction with the team and job as the dependent variable and the agile methodology followed as the factor, weighted by the complexity level of the project. The full output is in Appendix 2. It does not support a relationship: F(7, 102) = 1.310, p = .253, with an R square of .083 and an adjusted R square of .020. In plain terms, which agile methodology a team follows does not explain a meaningful part of how satisfied its members are, and the small adjusted R square says the model adds almost nothing once the number of predictors is taken into account. Appendix 1 reports a second, more elaborate univariate model that SPSS could not estimate at all, and explains why.
Regression Analysis
The third stage is a linear regression. The dependent variable is the level of challenge of the project; the predictors are the effectiveness of agile meetings and the satisfaction of the customer with the end product. The model summary below reports R, R square, adjusted R square and the standard error of the estimate.
|
Model Summary | ||||
|
Model |
R |
R Square |
Adjusted R Square |
Std. Error of the Estimate |
|
1 |
.246a |
.060 |
.042 |
1.32219 |
|
a. Predictors: (Constant), Effectiveness_of_agile_meetings, Satisfaction_of_customer_with_the_end_product | ||||
|
b. Dependent Variable: Level_of_challenge_of_the_project | ||||
Table 3: Regression model summary
(Source: SPSS)
The model is weak. R is .246, and the R square of .060 means the two predictors together account for about 6 per cent of the variance in the reported level of challenge, leaving roughly 94 per cent unexplained. The adjusted R square of .042 is lower still, which is what happens when predictors add little. The standard error of the estimate is 1.32 on the same five-point scale as the dependent variable, so the model's typical error is more than a full scale point.
|
ANOVAa | ||||||
|
Model |
Sum of Squares |
df |
Mean Square |
F |
Sig. | |
|
1 |
Regression |
11.348 |
2 |
5.674 |
3.246 |
.043b |
|
Residual |
176.566 |
101 |
1.748 | |||
|
Total |
187.913 |
103 | ||||
|
a. Dependent Variable: Level_of_challenge_of_the_project | ||||||
|
b. Predictors: (Constant), Effectiveness_of_agile_meetings, Satisfaction_of_customer_with_the_end_product | ||||||
Table 4: ANOVA for the level of challenges in the agile project
(Source: SPSS)
The ANOVA table tests whether the model as a whole predicts the dependent variable better than its mean does. It does, narrowly: F(2, 101) = 3.246, p = .043. Because .043 is below the conventional threshold of .05, the regression is statistically significant at that level, though only just. Note also the total degrees of freedom of 103, which implies 104 cases in this test rather than the 124 in the frequency table. A significant F with an R square of .060 is not a contradiction: it says the model captures a real but very small amount of the variation in how challenging a project is reported to be.
|
Coefficientsa | ||||||
|
Model |
Unstandardized Coefficients |
Standardized Coefficients |
t |
Sig. | ||
|
B |
Std. Error |
Beta | ||||
|
1 |
(Constant) |
1.216 |
.523 |
2.326 |
.022 | |
|
Satisfaction_of_customer_with_the_end_product |
.205 |
.116 |
.181 |
1.759 |
.082 | |
|
Effectiveness_of_agile_meetings |
.141 |
.127 |
.114 |
1.107 |
.271 | |
|
a. Dependent Variable: Level_of_challenge_of_the_project | ||||||
Table 5: Coefficient analysis
(Source: SPSS)
The coefficients table gives the t and Sig. values for each predictor separately, and neither reaches significance. Satisfaction of the customer with the end product has B = .205, t = 1.759, p = .082, and the effectiveness of agile meetings has B = .141, t = 1.107, p = .271. Both p-values are above .05, so on this sample neither predictor has a demonstrable individual effect on the level of challenge once the other is held constant. The constant is significant (p = .022), which tells us nothing of interest.
That leaves an apparent puzzle worth stating rather than smoothing over: the model is significant as a whole (p = .043) while neither of its two predictors is significant on its own. This happens when two correlated predictors share the explanatory work between them, and it is a reason to be cautious. The defensible conclusion from Tables 3 to 5 is that meeting effectiveness and customer satisfaction are jointly and weakly associated with the level of challenge reported, and that this data cannot show which of the two does the work.
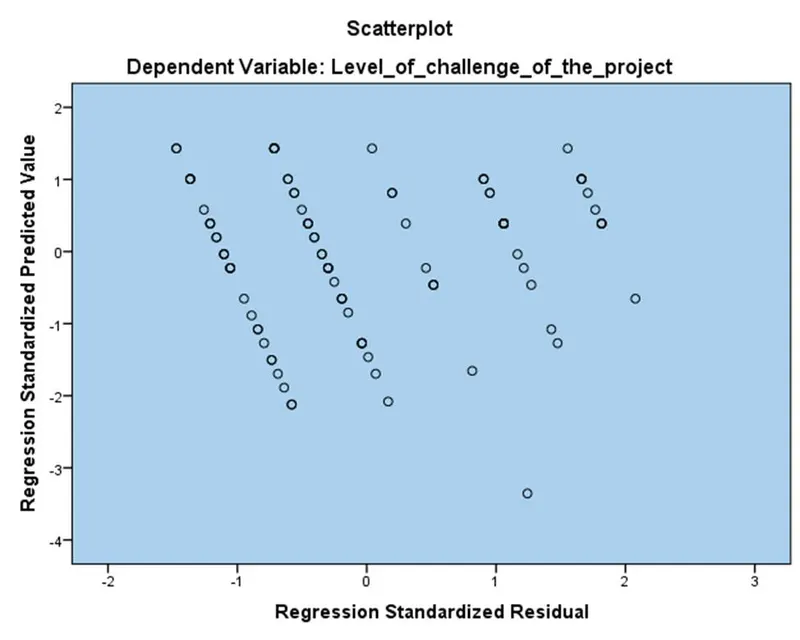
Figure 3: Scatter plot for the residual output
(Source: SPSS)
The residual scatter plot is the standard check on that regression. Its points fall in five parallel diagonal bands, one for each value of the five-point dependent variable, which is the pattern a linear regression produces when its outcome is a short rating scale. There is no funnel shape, so no strong sign that the spread of the residuals changes with the predicted value, and the standardised residuals stay between about -1.5 and 2.1. The banding does mean the plot cannot confirm linearity, and it is one more reason to read the model as a rough and weak fit: an ordinal regression would suit a five-point outcome better.
3. Discussion on Findings
The findings above come from 124 questionnaire responses from IT professionals in consultancy firms, analysed in SPSS with descriptive statistics, correlation, covariance and regression. This section reads those results against the research objectives. The order is deliberate: the tests are reported first and interpreted second, because the interpretation of a weak model is exactly where a findings chapter tends to overreach.
Analysis of Factors that Influence on the Agile Project Team Management
The descriptive stage answers the question of who these findings come from, and that matters for how far they travel. Respondents were split between product companies (about 42 per cent) and project companies (about 40 per cent), with 8 per cent in hybrid companies; the largest role group were Scrum masters or product owners (about 36 per cent), followed by project managers (about 23 per cent). Team sizes cluster between three and twenty members, and most respondents have seven years of experience or more. The sample is therefore experienced, senior and weighted towards the people who run agile processes rather than those who work inside them, which is a limitation as much as a strength.
The correlation stage answers the question of which factors move together. Clarity of objectives, backlog elaboration and task difficulty are each positively associated with the level of challenge reported, with clarity of objectives showing the strongest relationship (r = .413). All six correlations are significant at the 0.05 level, and all are weak to moderate in size. The practical reading is that the variables a team controls at the start of a sprint, how clearly the objective is stated and how well the backlog is prepared, are related to how hard the project feels once it is running, but that they are not the whole story.
Challenges Associated with the Agile Team Management
The covariance stage asked whether the choice of agile methodology explains how satisfied a team is with its work. It does not: in the univariate analysis in Appendix 2 the methodology factor gives F(7, 102) = 1.310, p = .253, with an adjusted R square of .020. This is a useful negative result for the research question, because it shifts the explanation of team satisfaction away from the framework a company has adopted and towards the conditions in which it is applied: team size, clarity of objectives and the challenges described in the next subsection.
The Significance and Suitability of Agile Project Management in Firms
The regression stage tested whether the effectiveness of agile meetings and customer satisfaction with the end product predict the level of challenge in a project. The answer is a qualified yes at the level of the model and a no at the level of each predictor: F(2, 101) = 3.246, p = .043, but R square is only .060 and neither predictor is individually significant (p = .082 and p = .271). The honest conclusion is that this study identifies an association and cannot establish a direction or a mechanism. Anyone repeating it would need a larger sample, a longitudinal design, or both, before claiming that better meetings reduce project difficulty.
4. Conclusion
This chapter set out to identify the challenges and gaps in agile project management in IT project consultancies, using primary data from practitioners rather than the literature alone. The questionnaire produced a profile of how these firms start projects, how large their teams are, how often they meet clients and how challenging they find the work; the statistical tests then examined which of those factors move together. The results are modest in size and clear in direction: the conditions set at the start of a sprint are associated with the difficulty reported later, while the choice of agile framework is not associated with team satisfaction at all.
4.1 Introduction
The value of primary data here is that it describes what practitioners report rather than what the method prescribes. The literature on agile project management is still at an early stage (Bergmann and Karwowski, 2018), so evidence from people currently running agile teams in consultancies is useful to the firms deciding how to structure them.
The findings are addressed to three groups: senior management deciding how agile delivery is organised, individual practitioners working inside agile teams, and the project management field. All the respondents work in firms that already use agile methods, so the study describes agile after adoption rather than the move to it.
4.2 Linking with Objectives
Each research question is taken in turn below, with the part of the analysis that answers it. Where the data does not answer a question, that is said rather than implied.
What are the defining guidelines for an agile team?
On the evidence here, an agile team is defined by four working conditions rather than by a certification: clear objectives, an elaborated product backlog, regular meetings and communication, and a team size that suits the work. Team size in this sample clusters between three and twenty members. To those four the respondents added the qualities that make the conditions hold: credibility, support, motivation and reliability within the team.
What are the contextual factors of agile project team?
The contextual factors reported by respondents are expertise, communication, flexibility, trust, empowerment, clear roles and responsibilities, and team size. These do not operate independently. A change in one, a team that grows beyond the size it can coordinate, for instance, shows up as a change in the others, which is why the correlation results above should be read as a system rather than as separate effects. The literature names the same ingredients: Behrens et al. (2021) characterise agile project management by daily reactivity, communication and flexibility, and the Association for Project Management (n.d.) lists trust, flexibility, empowerment and collaboration among the central values and behaviours of an agile project.
What are the challenges that agile team management face?
The evidence is the open question in Appendix 3. Read across the labelled answers, three kinds of problem recur. The first is money: budget pressure, budget restriction and impractical budgets. The second is people: communication gaps between team members and between the team and its leader, a lack of collaboration, conflict and trust issues. The third is planning: impractical deadlines, unclear or missing objectives, and scope creep. Scope and communication are also where Marnada et al. (2022) locate the most significant challenges across the published studies, while Kalenda, Hyna and Rossi (2018) show that scaling agile across a large organisation brings its own, among them resistance to change and an overly aggressive roll-out.
What is the contextual role of the leader in the agile team development?
Leadership is where the respondents placed the most weight. Their answers describe a leader who sets sprint objectives, holds the team to them, protects it from changing requirements and builds the conditions in which it can organise itself. The conclusion the data supports is narrow but useful: a culture that supports agility has to be led rather than mandated, because nothing in the framework itself produces trust or shared responsibility. The literature supports both halves of that reading. Kalenda, Hyna and Rossi (2018) found company culture and management support among the key success factors when a large software company scaled agile, and Aleinikova et al. (2020) note that Scrum works badly in organisations with a strong traditional culture of subordination and control.
Do companies need to rely always on the agile team project management?
No. The data does not support the claim that every company should use agile methods for every project, and the study did not test it. What the responses do show is that these consultancies chose agile methods because their clients change requirements during delivery, which is the condition the method is built for: agile methods became popular in software development because they offer ways to adapt to constant change (Bott and Mesmer, 2020). Where requirements are fixed and the schedule is contractual, a plan-led approach still answers the brief better. The defensible conclusion is that the choice of method should follow the volatility of the requirements rather than the popularity of the framework.
4.3 Future Research Scope
This study has clear limits, and they point directly at the work that would follow it. The sample is a single questionnaire administered to practitioners in a small number of consultancies, and the number of usable cases falls from 124 questionnaires to between 104 and 111 in the individual tests, so the results describe this group rather than the sector. Several questions also hold answers that belong to other questions (the respondent profile in section 2), and a repeat study should check its data entry before any test is run. The statistical relationships found are weak, which means a larger sample would be needed to establish whether they hold. A longitudinal design would be more informative still, because the interesting question, whether clearer objectives reduce the difficulty reported later, is a question about sequence and a questionnaire cannot see sequence. Interviews would add the mechanism that the numbers here cannot supply, and a study covering more than one country would test whether the same challenges appear elsewhere.
4.4 Recommendations
Two kinds of recommendation follow from this chapter: what IT consultancies might do, and what a further study should do differently. On the research side, the comparison this study could not make is between firms at different stages of agile adoption, analysed with the same instrument.
On the practical side, three recommendations are supported by the findings. First, IT consultancies should provide agile coaching, internal or external, because the challenges reported are about practice rather than about understanding the framework, and because Scrum requires training of team members and changes the management structure significantly (Aleinikova et al., 2020). Second, team leads should work as Scrum masters in substance and not only in title: setting sprint objectives clearly, keeping them stable within the sprint, and protecting the team from changing requirements, since clarity of objectives is the variable most strongly associated with the level of challenge reported. Third, performance management should be set at team level rather than individual level, because the factors respondents named, communication, trust and shared responsibility, are properties of a team and not of a person.
4.5 Conclusion
To summarise the chapter: the study asked which challenges and gaps appear when IT consultancies run agile teams, and answered it with a questionnaire of practitioners analysed in SPSS. The descriptive stage profiled the respondents and their projects. The correlation stage found weak but statistically significant positive relationships between clarity of objectives, backlog elaboration, task difficulty and the level of challenge reported. The covariance stage found no relationship between the agile methodology followed and satisfaction with the team and job. The regression stage produced a model that is significant as a whole and weak in explanatory power, with neither predictor significant on its own.
Read together, those results support one conclusion and rule out another. They support the view that the conditions a team sets at the start, clear objectives and a prepared backlog, are associated with how difficult the work becomes, and that leadership is what creates those conditions. They do not support the view that adopting a particular agile framework improves how a team experiences its work. The recommendations above follow from the first finding; the limitations set out in section 4.3 are the reason none of them is stated more strongly than the data allows.
5. Reference List
Aleinikova, O., Kravchenko, S., Hurochkina, V., Zvonar, V., Brechko, O. and Buryk, Z., 2020. Project management technologies in public administration. Journal of Management Information and Decision Sciences, 23(5), pp.564-576. abacademies.org
Association for Project Management, n.d. What is agile project management? Available at: apm.org.uk (Accessed: 24 September 2026).
Behrens, A., Ofori, M., Noteboom, C. and Bishop, D., 2021. A systematic literature review: how agile is agile project management? Issues in Information Systems, 22(3). doi.org/10.48009/3_iis_2021_298-316
Bergmann, T. and Karwowski, W., 2018. Agile project management and project success: A literature review. In International Conference on Applied Human Factors and Ergonomics (pp. 405-414). Springer, Cham. doi.org/10.1007/978-3-319-94709-9_39
Bott, M. and Mesmer, B., 2020. An analysis of theories supporting agile scrum and the use of scrum in systems engineering. Engineering Management Journal, 32(2), pp.76-85. doi.org/10.1080/10429247.2019.1659701
Kalenda, M., Hyna, P. and Rossi, B., 2018. Scaling agile in large organizations: practices, challenges, and success factors. Journal of Software: Evolution and Process, 30(10), e1954. doi.org/10.1002/smr.1954
Marnada, P., Raharjo, T., Hardian, B. and Prasetyo, A., 2022. Agile project management challenge in handling scope and change: A systematic literature review. Procedia Computer Science, 197, pp.290-300. doi.org/10.1016/j.procs.2021.12.143
6. Appendices
Appendix 1: Univariate Analysis of Variance
The table below is an excerpt from the SPSS output for a univariate model of satisfaction with the team and job, with agile methodology, reported challenges and clarity of objectives entered as factors together with their interactions, alongside the suitability of team size. It cannot be interpreted. The open question on challenges enters the model as a factor with 83 degrees of freedom, several terms have zero degrees of freedom, and SPSS returned no F ratio and no significance value for any effect: the full stops are missing values, not small numbers. The model has more parameters than a sample of this size can support. The interpretable univariate output is in Appendix 2.
|
Tests of Between-Subjects Effects (excerpt) | ||||||
|
Dependent Variable: satisfied_are_you_with_your_team_and_job | ||||||
|
Source |
Type III Sum of Squares |
df |
Mean Square |
F |
Sig. | |
|
suitability_of_team_size_for_the_project |
Hypothesis |
1.714 |
1 |
1.714 |
. |
. |
|
Error |
.000 |
0 |
. | |||
|
challenges_you_face_in_the_team_and_project |
Hypothesis |
264.046 |
83 |
. |
. |
. |
|
Error |
. |
. |
. | |||
|
Rows omitted: the intercept, agile methodology, clarity of objectives and their four interaction terms. None has an F ratio or a significance value. | ||||||
(Source: SPSS)
Appendix 2: Covariance Tests of Variances
This is the univariate analysis of variance discussed in section 2. Satisfaction with the team and job is the dependent variable, the agile methodology followed is the factor, and the model is weighted by the complexity level of the project. The methodology factor gives F(7, 102) = 1.310 at p = .253, with an R square of .083 and an adjusted R square of .020, on 110 cases. The factor is therefore not significant: on this data the methodology a team follows does not explain its satisfaction.
|
Tests of Between-Subjects Effectsa | ||||||
|
Dependent Variable: satisfied_are_you_with_your_team_and_job | ||||||
|
Source |
Type III Sum of Squares |
df |
Mean Square |
F |
Sig. |
Partial Eta Squared |
|
Corrected Model |
29.118b |
7 |
4.160 |
1.310 |
.253 |
.083 |
|
Intercept |
875.884 |
1 |
875.884 |
275.935 |
.000 |
.730 |
|
Which_Agile_methodology_Do_you_follow |
29.118 |
7 |
4.160 |
1.310 |
.253 |
.083 |
|
Error |
323.772 |
102 |
3.174 | |||
|
Total |
6573.000 |
110 | ||||
|
Corrected Total |
352.890 |
109 | ||||
|
a. Weighted Least Squares Regression - Weighted by Complexity_level_of_the_project | ||||||
|
b. R Squared = .083 (Adjusted R Squared = .020) | ||||||
(Source: SPSS)
Appendix 3: Challenges Faced During Agile Project Management
The open question on challenges faced in the team and the project produced almost as many answers as respondents. Nearly every respondent worded the answer differently, so the SPSS frequency output counts most answers once, and its largest single count, twelve, is the respondents who left the question blank. That chart is not reproduced here because SPSS prints labels under only some of its bars; section 4.2 groups the labelled answers into themes.
Related samples: final project ideas for computer science and engineering students, our computer science dissertation sample and our business research methods sample for the methodology chapter that precedes this one. If you want to see the same tests chosen, checked and run from scratch on an open dataset, our statistics coursework sample does that in R and Excel.
Need help with a dissertation chapter or SPSS analysis of your own? Message us on WhatsApp with your research question, your data and your deadline, and we will tell you what we can do.
Sources
The Harvard reference list for the study is in section 5 above. These are works from that list with stable identifiers, so you can check them directly.
- Association for Project Management (n.d.). What is agile project management? apm.org.uk
- Bergmann, T. and Karwowski, W. (2018). Agile Project Management and Project Success: A Literature Review. Advances in Intelligent Systems and Computing, pp. 405-414. doi.org/10.1007/978-3-319-94709-9_39
- Marnada, P., Raharjo, T., Hardian, B. and Prasetyo, A. (2022). Agile project management challenge in handling scope and change: A systematic literature review. Procedia Computer Science, 197, pp. 290-300. doi.org/10.1016/j.procs.2021.12.143
- Kalenda, M., Hyna, P. and Rossi, B. (2018). Scaling agile in large organizations: Practices, challenges, and success factors. Journal of Software: Evolution and Process, 30(10), e1954. doi.org/10.1002/smr.1954
- Bott, M. and Mesmer, B. (2020). An Analysis of Theories Supporting Agile Scrum and the Use of Scrum in Systems Engineering. Engineering Management Journal, 32(2), pp. 76-85. doi.org/10.1080/10429247.2019.1659701
- Aleinikova, O., Kravchenko, S., Hurochkina, V., Zvonar, V., Brechko, O. and Buryk, Z. (2020). Project management technologies in public administration. Journal of Management Information and Decision Sciences, 23(5), pp. 564-576. abacademies.org
- Behrens, A., Ofori, M., Noteboom, C. and Bishop, D. (2021). A systematic literature review: how agile is agile project management? Issues in Information Systems, 22(3). doi.org/10.48009/3_iis_2021_298-316
Frequently Asked Questions
What are the main challenges in agile project management?
The open answers in this study keep returning to budgets, to communication inside the team and with its leader, and to planning: deadlines that cannot be met, objectives that are unclear and scope that keeps growing. Published reviews find the same scope and communication problems and add the difficulty of scaling agile across a large organisation.
What statistical tests does this chapter use?
Descriptive statistics for the respondent profile, Pearson correlation between project clarity, product backlog, task difficulty and level of challenge, covariance and univariate analysis of variance for team and job satisfaction, and linear regression with an ANOVA table testing whether meeting effectiveness and customer satisfaction predict the level of challenge. All output is produced in SPSS.
How do I structure a findings and discussion chapter?
Report before you interpret. Present each test with its table, state what the output says in one or two sentences, and leave the argument for the discussion section. Then organise the discussion around your research questions rather than around the tests, so a marker can see each question answered. Put full SPSS output in appendices.
What role does the leader play in an agile team?
The respondents in this study placed leadership at the centre of agility. A leader sets sprint objectives, protects the team from changing requirements, and builds the culture that lets a team self-organise. The chapter concludes that a culture supporting agility has to be led rather than mandated, which is consistent with the scaling literature.
Can I use this as a template for my own dissertation?
Use the structure, not the content. The sequence here (descriptive, correlation, covariance, regression, then discussion mapped to research questions) is a standard shape for a quantitative findings chapter. The data, the sample and the conclusions belong to this study, so your own analysis and citations must be your own.