
Probability and Statistics Assignment Help Example
A worked probability and statistics assignment. A car rental company with a fleet of 300 cars and a 10% repair rate per rental has to decide how many bookings to accept in a peak week. The sample uses the normal approximation to the binomial distribution to answer three probability questions and then lists the data a consultant would need.

This is a worked probability and statistics assignment produced for one of our students. It takes a car rental company with a fleet of 300 cars and a 10% chance that any returned car needs repair, and asks how many bookings the company should accept in a peak week. The method is the normal approximation to the binomial distribution, and the workings are shown at each step.
The sample is written at first-year undergraduate level for a quantitative methods or business statistics module. If your module works with logic rather than probability, see our Boolean algebra sample. For a numerical business problem of a different kind, read the financial analysis sample. For a worked engineering calculation set out the same way, step by step with units, read the shear force and bending moment diagram worked example.
What Does This Statistics Assignment Sample Cover?
The sample covers one business question taken from words to a decision with the normal approximation to the binomial. Setting up the model and turning each cut-off into a z-score are routine once you have seen them done. The step most students lose marks on is the last: working backwards from a target probability to a booking limit.
Normal approximation to the binomial for a 300-car fleet, in four steps
- Recognise the binomial Each rental ends one of two ways, repair or no repair, so n = 300 and p = 0.9 for a car that needs no repair.
- Check the rule and match a normal n·p = 270 and n·(1−p) = 30 are both greater than five, so X ~ N(270, 27), with standard deviation √27 ≈ 5.196 cars.
- Turn each cut-off into a z-score (260 − 270) ÷ 5.196 ≈ −1.92 gives 2.74% for part a; (275 − 270) ÷ 5.196 ≈ 0.96 gives 16.85% for part b.
- Work back to a booking limit A 4% upper tail is z ≈ 1.75, so 270 + (1.75 × 5.196) ≈ 279.1 and the company should accept more than 279 bookings.
The context is deliberately practical. Repairs are one of the largest costs a car rental firm carries, and in a beach resort almost all the demand arrives in July and August. Accepting too many bookings means paying a competitor's rate to honour a quote; accepting too few means cars sitting idle in the one month they could be earning.
Question: Probability Analysis for Car Rental Fleet Management During Peak Season
Details of the Question
One of the largest costs of a car rental company is the cost of repairing the cars both due to damage and to normal wear and tear. Rent‐a‐Car plc is analyzing the cost and pattern of vehicle repairs to ensure it has enough cars available during peak time. Peak time for Rent‐a‐Car, which is located in a beach resort, is during the months of July and August, where the average rental is for one week. Rent‐a‐Car has a fleet of 300 cars and over time it has collected data that indicate the probability of a car needing repairs after each rental is completed is 10%. Considering the location and the information above, most cars will be returned, cleaned and rented out on the same day. If a car needs repairs and no other car is available, Rent‐a‐Car will either send the customer away or, if the customer has pre‐ booked, rent a car from another company and honor the quote the customer has irrespective of what the other company charges, normally resulting in a loss for Rent‐a‐Car. The so‐called binomial distribution can be used to describe uncertain situations of this kind where there are two possible outcomes; a car needs a repair or not. Fortunately, the binomial distribution can be approximated by the normal distribution such that the number of cars available for rent is normally distributed with a mean of n∙p and a standard deviation of the square root of n∙p∙(1−p), where n is the fleet size and p is the probability of a car not needing repair.
a) If Rent‐a‐Car commits to 260 bookings in any one week, what is the probability that there will not have enough cars to meet all bookings?
b) If Rent‐a‐Car commits to 275 bookings in any one week, what is the probability that there will be cars available to meet all bookings?
c) If Rent‐a‐Car wants to have no more than a 4% probability of having idle cars, what's the minimum number of rentals it should agree to in any one week?
d) You have been hired as a consultant for Rent‐a‐Car. You have understood the probability structure of the car availability problem, and the next step is to advise them on how many car rentals to allow during the months of July and August. Please make a list of the data you would need to get from the car rental company in order to make your recommendation.
How Do You Approximate a Binomial Distribution with a Normal One?
Check that the sample is large enough, then match the two distributions on mean and variance. A binomial with n trials and success probability p has mean n·p and variance n·p·(1−p). If n·p and n·(1−p) are both greater than five, a normal distribution with the same mean and variance gives probabilities close enough to use.
In this problem the trial is a single rental and the "success" is a car that does not need repair, so p = 0.9 and n = 300. That gives n·p = 270 and n·(1−p) = 30, both far above five, so the approximation is sound and the assignment can be answered with z-scores instead of 300 binomial terms (NIST/SEMATECH, 2013; OpenStax, 2023).
Three points worth stating in your own answer, because markers look for them:
- Name the random variable. Let X be the number of cars that do not need repair after a rental. Everything else follows from that definition.
- Be explicit about which parameter is which. Writing X ~ N(270, 27) uses the variance as the second parameter. The standard deviation is √27 ≈ 5.196 cars, and that is the number you divide by when you compute a z-score.
- Say whether you used a continuity correction. OpenStax (2023) adds or subtracts 0.5 at each cut-off, because a count of cars is a whole number and the normal curve is continuous, so part a would use 259.5 and part b 274.5. This question defines the car count as normal outright, and the solution below uses 260 and 275 as they stand. If your module teaches the correction, apply it and say so.
Solution: The Worked Answers
Rent‐a‐Car has a fleet of 300 cars, so n=300
probability of a car needing repairs after each rental is completed is 10%
so, the probability of a car not needing repairs after each rental is completed,
p=90%
Let X be a random variable representing the number of cars that do not need repairs after a rental
X ~ N(n·p, n·p·(1−p))
X ~ N(300 × 0.9, 300 × 0.9 × 0.1)
X ~ N(270, 27), so the standard deviation is √27 ≈ 5.196 cars
Now, Solutions of a,b,c, and d:
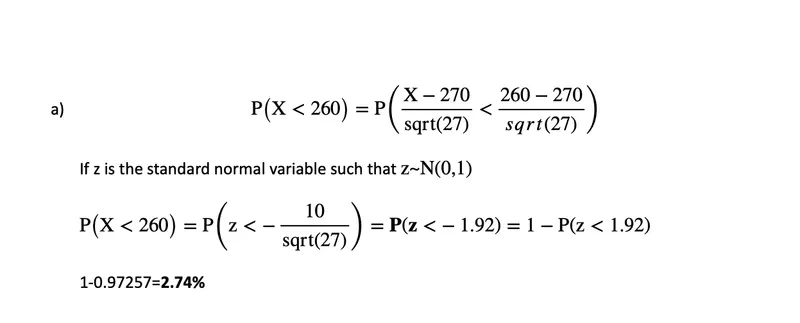
a) The company is short of cars when fewer than 260 are serviceable. The z-score is (260 − 270) ÷ 5.196 ≈ −1.92, and the area to the left of that point is 1 − 0.97257, so the probability is 1-0.97257=2.74%
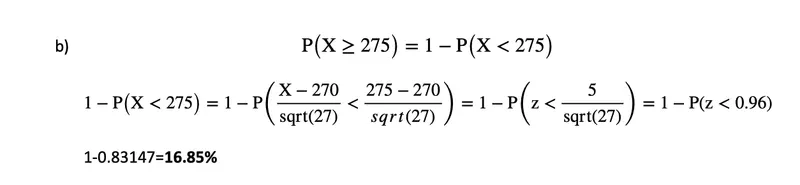
b) With 275 bookings the company needs at least 275 serviceable cars. The z-score is (275 − 270) ÷ 5.196 ≈ 0.96, so the probability of meeting all bookings is 1-0.83147=16.85%
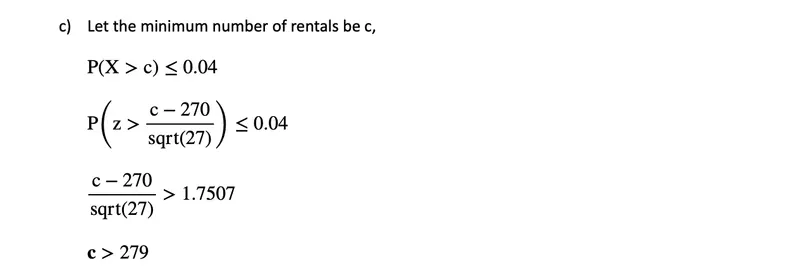
c) This part runs the calculation backwards. A 4% upper tail corresponds to a z-score of about 1.75, so the cut-off is 270 + (1.75 × 5.196) ≈ 279.1, which gives c>279
What Data Would You Need to Advise the Company?
d) Data required from Car-Rental company:
- Number of cars given on rent per day at least for the last six months
- Of the above cars, number of cars that needed repairs after each rental was completed.
- Statistical analysis for past Peak time that is, last year’s July and August.
- All the 300 cars sorted by the condition of the car, namely: Great, Moderate, Poor.
- Cost of parking for idle cars
- Expected loss for when Rent-a-car will rent from another company when it has pre-booked and no car is available.
- Past data of cases of theft.
- Average number of days a car is rented by a customer.
Notice what that list is doing. Parts a to c answer a probability question, but part d turns it into a cost question: the right booking limit depends on how much an idle car costs compared with how much a broken promise costs. An answer that says so, rather than just listing data, reads as the consultant the question asks you to be.
More worked solutions are in our maths and science assignment samples, and the service page is science and maths assignment help. If your module is research methods rather than pure statistics, the business research methods assignment sample shows how the same statistics get used in a study design. For a full coursework with a dataset, hypothesis tests and a regression, every step shown in R and Excel, read our statistics coursework sample.
Need a probability or statistics question worked with the method shown? Message us on WhatsApp with the question sheet and the deadline.
Sources
- NIST/SEMATECH (2013) Binomial distribution, e-Handbook of Statistical Methods, section 1.3.6.6.18. itl.nist.gov. Source for the binomial mean and variance formulae.
- OpenStax (2023) Using the Central Limit Theorem, Introductory Statistics 2e, section 7.3 (historical note, "Normal Approximation to the Binomial"). openstax.org. Source for the rule that n·p and n·(1−p) must both be greater than five before a binomial is approximated by a normal distribution, and for the 0.5 continuity correction.
Frequently Asked Questions
When can you use the normal distribution instead of the binomial?
When the expected number of successes, np, and the expected number of failures, n(1 minus p), are both greater than five. That is the rule of thumb OpenStax gives. Here n is 300 and p is 0.9, so np is 270 and n(1 minus p) is 30. Both clear five by a wide margin, so the approximation is safe.
How do you find the mean and standard deviation of a binomial distribution?
The mean is n times p and the variance is n times p times one minus p. The standard deviation is the square root of that variance. In this problem n is 300 and p is 0.9, so the mean is 270 cars, the variance is 27 and the standard deviation is the square root of 27, about 5.196 cars.
What does this car rental probability question actually ask?
It asks for the chance of being short of cars if 260 bookings are accepted, the chance of having enough cars if 275 are accepted, and the number of bookings that keeps the chance of idle cars at no more than 4%. Part d then asks what extra data a consultant would request.
How do you turn a probability into a booking limit?
Work backwards from the z-score. For a 4% upper tail the z-score is about 1.75, so the cut-off is the mean plus 1.75 standard deviations: 270 plus about 9.1, which is roughly 279. The company should accept more than 279 bookings a week to keep idle cars below that threshold.
Do you write statistics assignments with the workings shown?
Yes. Every solution shows the distribution used, the formula, the substituted values, the z-score and the final answer with its units, because that is where most of the marks are. Send us the question sheet and the deadline on WhatsApp and we will tell you what we can do.