
Digital Marketing Strategy for a Food Delivery App: Be One to Give Case Study
A digital marketing campaign plan written as an MBA and report-writing sample for Be One to Give, a surplus-food logistics app in Toronto. It runs a situation analysis with PEST and SWOT, an NAICS industry analysis, STP and personas, then the tactics: social media, on-page and off-page SEO, PPC, budget, content pillars and KPIs.

This is a digital marketing campaign plan written as a sample for an MBA marketing module. The client is Be One to Give, a Toronto company whose app moves surplus food from hospitality and food-service businesses to communities that need it. The report runs a situation analysis, PEST and SWOT, an NAICS industry analysis, segmentation and personas, then the channel plan: social media, on-page and off-page SEO, PPC, budget, content pillars and the measurement framework.
How Does a Food Delivery App Market Itself?
It depends on the customer. A consumer delivery app buys installs and search clicks, competes for app store and local rankings, and works to keep diners who can switch in a tap. Be One to Give's customer is the business giving food away, so it is marketed like a business service: through LinkedIn, search and client references.
The proposition is partly ethical, which changes the message and the audience but not the mechanics: the plan below still has to name a segment, reach it at a cost the unit economics can carry, and prove the spend worked.
What Goes into a Digital Marketing Campaign Plan?
A campaign plan runs from analysis to measurement in a fixed order: a situation analysis of company, customers and competitors; an external scan using PEST and SWOT; segmentation, targeting and positioning with personas; SMART objectives; the channel tactics and budget; an implementation timeline; and the measurement plan. Each section should feed the next rather than stand on its own.
The commonest weakness in a student plan is a break between the analysis and the tactics: a careful SWOT followed by a channel list that could have been written without it. Every tactic below is tied back to something the analysis found. More marketing samples are in our MBA assignment samples. If your plan is for an MBA module, our MBA assignment help page covers marketing and strategy work, and report writing help covers the report format.
Digital Marketing Campaign Project for a Food Delivery App: Be One to Give
The plan follows in three parts: the situation analysis, the objectives and business model, and the tactics. Its digital marketing audit records what the company's public website showed on 24 September 2026.
Assignment Question
Analyze the digital marketing strategies used by food delivery apps, focusing on SEO, PPC and social media marketing. Use Be One to Give as a case study to evaluate campaign effectiveness and customer engagement.
Executive Summary
Be One to Give is a Toronto business that offers "same-day pickup and redistribution of your surplus food", built as an app that lets retailers and food-service operators "track, manage, and eliminate surplus food in their daily operations" (B12Give, 2026). It sells to businesses, not to diners, which is the single fact that shapes every recommendation in this plan.
The analysis finds a strong proposition and a website that does not yet sell it to any one type of buyer. The market problem it addresses is large and quantified: Second Harvest and Value Chain Management International valued Canada's avoidable lost and wasted food at $49.46 billion, of which 11.2 million tonnes is edible and could be redirected to people (Second Harvest, 2019), and their 2024 update found avoidable food waste up 6.5% even as total food waste fell by 20% (Second Harvest, 2024). The audit in section two found one general contact form, no page for any single type of client, no blog, and page titles that do not name the service. That gap between the size of the opportunity and the state of the marketing is what the plan is for.
The recommendation is a business-to-business campaign built on LinkedIn and search rather than on consumer social, with a twelve-month budget of $27,000, three SMART objectives, and a measurement framework that reports cost per lead alongside volume. The plan is deliberately narrow: one city, two buyer roles, and four channels.
What Does the Situation Analysis Show for Be One to Give?
A small business-to-business platform working on a large, quantified problem. Be One to Give moves surplus food from hospitality and food-service clients to communities in the Greater Toronto Area. The PEST scan finds a stable operating environment, the SWOT puts the weaknesses on the website rather than in the service, and the industry analysis sizes the sector it sells into.
Situation Analysis
The Client Company
Be One to Give, trading as B12Give, operates from Toronto, Ontario. Its service is same-day pickup and redistribution of surplus food, sold to retailers and food-service operators as a logistics and reporting service rather than as a charitable donation channel. The company names hospitality and education clients including the Fairmont Royal York, Sheridan College and the Oliver & Bonacini group on its own site (B12Give, 2026).
Two features of that model matter to a marketer. First, the buyer is a named role inside a business, usually a sustainability lead, a general manager or a purchasing manager, which rules out most consumer channels. Second, the product delivers a reportable number: kilograms diverted, meals delivered, disposal cost avoided. A business-to-business proposition that produces a figure the client can put in its own sustainability report is easier to sell than one that produces goodwill, and the content plan below is built around that figure.
Competitor Analysis
Be One to Give competes against three categories rather than against a list of named rivals, and a positioning map built from categories is more defensible in a student report than one that ranks real companies on invented quality scores.
| Competitor category | What it offers the client | Where Be One to Give differs |
|---|---|---|
| Charitable food-rescue organizations | Free or low-cost collection of donated food, with tax-receipt handling | Scheduled same-day collection with reporting, rather than collection when volunteers are available |
| Consumer surplus-food marketplaces | An app that sells surplus portions direct to the public at a discount | Sells to the business, removes the surplus entirely, and does not ask the client to run a retail channel |
| Waste-management contractors | Scheduled organic-waste collection priced by volume | Diverts edible food to people rather than to composting, which is the part a client can report |
The competitive position that follows is narrow and defensible: Be One to Give is the option for a business that wants the surplus gone on the same day, wants the diverted volume documented, and does not want to operate a discount storefront itself. The marketing job is to make that sentence findable by the two buyer roles named in the personas below.
PEST Analysis
| Political | Economic |
|---|---|
| Stable parliamentary democracy, which supports long-horizon investment and partnership agreements. Food safety, handling and certification rules govern how surplus food may be collected, stored and redistributed, and compliance with them is a condition of operating at all. Federal food policy treats food security as a stated objective, which gives a commercial food-rescue service a policy tailwind. | The agriculture and agri-food system generated $149.2 billion, around 7%, of Canada's GDP in 2024 and employed 2.3 million people, one job in nine (Agriculture and Agri-Food Canada, 2026). Interest rates and fuel costs feed directly into the cost of a logistics business, so both belong in the economic scan. Disposal costs rise with landfill and organics charges, which improves the commercial case for diversion. |
| Social | Technological |
| Food insecurity is widespread: 24.0% of Canadians, about 9.8 million people, lived in households reporting some form of food insecurity in 2024 (Statistics Canada, 2026). Public attention to food waste has moved from an operational issue to a social one, which changes who inside a client business cares about the service. | Mobile logistics, route optimization and real-time tracking are commodity technologies now, so the barrier to entry is operational rather than technical. Corporate sustainability reporting software creates demand for suppliers who can hand over clean diversion data. |
What the PEST Scan Means for the Plan
Three of the four quadrants point the same way. Political stability and an explicit federal interest in food security make the operating environment predictable, which is what allows a small company to sign multi-year contracts with large hospitality groups. The economic quadrant cuts both ways: a logistics business is exposed to fuel and interest rates, but rising disposal costs strengthen the pitch, because the comparison the client makes is between paying Be One to Give and paying to throw food away. The social quadrant supplies the campaign's message, since a client can now be sold on a problem its own customers and staff already recognize. Only the technological quadrant is a warning, because nothing in the service is technically hard to copy, which means the defensible asset is the client relationships and the reporting, not the app.
Ciulli, Kolk and Boe-Lillegraven (2020) describe exactly this kind of operator as a circularity broker: a digital platform organization that recovers waste in a food supply chain by connecting parties who would not otherwise transact. The framing is useful in a marketing plan because it names what the company actually sells, which is coordination rather than food.
SWOT Analysis
Three of the four weaknesses are on the website rather than in the service, and those three are cheap to fix. That is why the budget later in the plan pays for pages, tracking and people before it pays for media.
Be One to Give SWOT analysis, September 2026
Strengths Internal, helpful
- A clear, unusual offer: same-day pickup of surplus food, sold to businesses as a logistics service rather than as charity (B12Give, 2026).
- Impact a client can report: drivers weigh each pickup, and the company reports the social and environmental impact back to the client.
- Named reference clients: in hospitality and education, including the Fairmont Royal York and Sheridan College.
- Transparent pricing: prices published per pickup, so a buyer can compare the service with current disposal costs before making contact.
Weaknesses Internal, harmful
- Generic lead capture: one general contact form is the only enquiry route, and no page speaks to any single type of client (B12Give, 2026).
- No fresh content: no blog and no email signup, so the site has nothing new to rank or to send.
- Weak page titles: page titles name the company but not the service or the city, which leaves the site hard to find for the terms a buyer searches.
- Single-city footprint: Toronto is the only city the site names, so growth means entering new cities one at a time.
Opportunities External, helpful
- Plenty of food to rescue: Canada's avoidable lost and wasted food was valued at $49.46 billion, with 11.2 million tonnes edible and able to be redirected to people (Second Harvest, 2019).
- Avoidable waste rising: the 2024 update of the same study found avoidable food waste up 6.5% while total food waste fell by 20% (Second Harvest, 2024).
- Need stays high: 24.0% of Canadians, about 9.8 million people, lived in households reporting food insecurity in 2024, just over 360,000 fewer than a year earlier (Statistics Canada, 2026).
- Reporting as a selling point: corporate sustainability reporting gives a client a reason to buy that is not price, and the same method can be taken to other Canadian cities.
Threats External, harmful
- Low technical barriers: a waste-management contractor or a logistics operator could add the service.
- Free charity competitors: charitable food-rescue organizations collect at no charge, which caps what the service can be priced at.
- Reliance on reference clients: losing a named reference client would remove proof the next buyer checks.
- Shared food-safety risk: one food-safety incident in the chain would reach every client at once.
Industry Analysis (NAICS)
The North American Industry Classification System is the standard used by Canadian, United States and Mexican statistical agencies to classify businesses by their production process, which is what allows the same activity to be compared across the three countries (Statistics Canada, 2022). Be One to Give sits across two of its sectors rather than inside one: the service it sells is transportation and warehousing, while the market it sells into is food manufacturing, food retail and food services. A student writing this section should say which classification they are using and why, because the choice decides which industry figures are relevant.
Sized on the demand side, the sector is large. The agriculture and agri-food system generated $149.2 billion in 2024, around 7% of Canada's GDP, and employed 2.3 million people, one job in nine (Agriculture and Agri-Food Canada, 2026). Within that, food and beverage processing alone accounted for $35.8 billion of GDP and 318,400 jobs. Those figures do not measure Be One to Give's market directly, and the plan does not pretend otherwise: what they establish is that the buyer population in the Greater Toronto Area is deep enough to support a focused campaign, which is all an industry analysis needs to establish at this stage.
Segmentation, Targeting and Positioning
Segmentation, targeting and positioning divide a market, choose a part of it, and state what the brand will mean to that part. In a business-to-business plan the segmentation variables are firmographic and behavioural rather than demographic, because the buyer is a role rather than a household.
| Stage | Detail |
|---|---|
| Segmentation | Firmographic: hotels, contract caterers, university and college food services, grocery retailers and food manufacturers in the Greater Toronto Area, with enough daily volume for a scheduled pickup to be worth buying. Geographic: Greater Toronto Area first, with a second city added only once the first is profitable. Behavioural: businesses already reporting on waste or emissions, businesses paying organics disposal charges, and businesses with a public sustainability commitment. Psychographic: buyers who treat food waste as a reputational issue as well as a cost line. |
| Targeting | A concentrated strategy on two roles inside the firmographic segment: the sustainability or operations lead who owns the commitment, and the purchasing or supply chain manager who owns the contract. Both have to be reached, because the first creates the requirement and the second signs. |
| Positioning | For food businesses in Toronto that want their surplus gone the same day and documented, Be One to Give is the logistics partner that removes edible food to people rather than to landfill and hands back the numbers. Unlike a charitable collection, it is scheduled and contracted; unlike a waste contractor, what it diverts can be reported as meals rather than as tonnage. |
Persona Analysis
Both personas below are invented, as a marketing plan requires. Each one carries what it needs to be usable: the decision they own, the budget they hold, what would stop them buying, and where they can be reached.
Persona 1: Sustainability Lead, Hotel Group
| Name and role | Emma, sustainability manager for a four-hotel group |
| Location | Toronto |
| Owns the decision to | Meet a published waste-diversion commitment and report against it annually |
| Budget | No direct budget; builds the business case and takes it to operations |
| Buying behaviour | Compares suppliers on the quality of the reporting, not the price. Asks for a pilot at one property before committing the group. Checks whether the supplier is certified and whether other hotels use it. |
| What stops her | Cannot prove the diverted volume to an auditor, or the pickup schedule does not fit kitchen close-down times |
| Where to reach her | LinkedIn, hospitality sustainability newsletters, industry association events, and search terms about waste-diversion reporting |
Persona 2: Purchasing Manager, Contract Caterer
| Name and role | John, supply chain and purchasing manager for a contract catering business |
| Location | Greater Toronto Area |
| Owns the decision to | Sign and renew service contracts, including waste and disposal |
| Budget | Holds the disposal and logistics line, and is measured on cost per site |
| Buying behaviour | Compares the quoted cost against current organics disposal charges. Wants a single invoice across sites and a named account contact. Renews annually and switches if the service misses pickups. |
| What stops him | A price above current disposal cost with no offsetting reporting benefit, or a supplier that cannot cover every site |
| Where to reach him | Search for disposal and organics collection terms, LinkedIn, supplier directories, and referral from an existing client |
Customer Journey
The stages below are written for the two personas above rather than in the abstract, and each one names the marketing asset that has to exist for the buyer to move on. The audit in section two puts the gaps at consideration and purchase: client references exist, but there is no case study or landing page for any type of client, and the only enquiry route is a general contact form. That is where the tactics in section three start.
| Stage | What the buyer does | Asset required |
|---|---|---|
| Awareness | Hears about the service through a peer, an association event, or a search for organics disposal or waste-diversion reporting | Search visibility for those terms, and a LinkedIn presence that a peer can point at |
| Consideration | Checks whether other businesses like theirs use it, and what the reporting looks like | Named client references, a sample diversion report, and a case study page per client type |
| Purchase | Requests a quote, negotiates the schedule and the sites covered, signs | A quote request on a landing page for the buyer's type of business; the audit found one general contact form and no page per client type |
| Usage | Receives scheduled pickups and monthly diversion figures | A reporting dashboard or a monthly report that can be forwarded internally |
| Post-purchase | Uses the figures in an internal or public sustainability report, and decides whether to renew | An annual summary built for that use, and a referral route to the buyer's peers |
What Are the Objectives and the Business Model?
The plan sets three SMART objectives: four to five per cent more contracted client sites within one year, a two to three per cent cut in the operation's own carbon footprint within one year, and roughly ten per cent more revenue within five years. The model is business to business: a contracted collection service sold to food businesses.
Objectives
One-Year Objectives
| Test | Objective 1: increase contracted client sites in the Greater Toronto Area by 4 to 5% within twelve months | Objective 2: reduce the operation's carbon footprint by 2 to 3% within twelve months |
|---|---|---|
| Specific | Win new contracted clients in the Greater Toronto Area within the firmographic segment defined above, rather than growing volume at existing sites | Cut emissions per tonne collected by consolidating routes and reducing empty running |
| Measurable | Contracted sites at each month end against the count on launch day, with tonnes collected reported alongside from the weights drivers record at pickup | Counted as kilometres driven per tonne collected, from the same dispatch records |
| Achievable | The target is modest, and the gaps the audit found are cheap ones: one general contact form and no page for any type of client, both fixable in the first month | Route consolidation is within the company's own control and needs no client agreement |
| Relevant | New contracted sites are what the marketing budget can actually move, and each new client adds a reference for the next buyer to check | The claim the company sells on is environmental, so its own footprint has to stand up to the question |
| Time bound | Twelve months from campaign launch, reviewed quarterly | Twelve months, measured against the preceding twelve |
Five-Year Objective
| Test | Objective 3: increase revenue by approximately 10% over five years |
|---|---|
| Specific | Growth from two sources: more contracted sites in the Greater Toronto Area, and entry into one further Canadian city |
| Measurable | Annual revenue compared with the year before the plan began |
| Achievable | The method is already proven in one city and does not depend on new technology, only on repeating the sales motion |
| Relevant | Revenue growth is what funds the second city, which is the only route out of the geographic limit named in the SWOT |
| Time bound | Five years, with a go or no-go decision on the second city at the end of year two |
Overall Strategy (Business Model)
The model is business to business. Be One to Give sells a contracted service to food businesses: scheduled collection of surplus, redistribution to community organizations, and a report of what was diverted. Revenue comes from the service fee, and the client's alternative is paying for organics disposal, so the price ceiling is set by disposal cost plus whatever the reporting is worth to them.
Growth within that model has three routes, and the plan should say which one it is funding. Adding sites at existing clients is the cheapest and is a sales job rather than a marketing one. Adding new clients in the same city is what this campaign is for. Adding a city is the expensive route and is held back to the five-year objective. A fourth route, partnering with a waste-management contractor to be their diversion sub-supplier, would reach buyers who never search for this service at all, and it is worth naming as an option even though this plan does not budget for it.
Digital Marketing Audit
The audit below is the evidence base for the whole plan. It records what Be One to Give's public website and app listings showed on 24 September 2026 (B12Give, 2026), and nothing else. What it finds missing is more useful than what it finds in place, because the gaps are cheap to fix and each one slows a stage of the buying process set out above.
| Item | What the site showed, 24 September 2026 |
|---|---|
| Channels | |
| Website | Six pages: home, about, problem, solution, gallery and contact |
| Social media | LinkedIn, Facebook and Instagram, linked from every page |
| Mobile application | A partner app for retailers on the App Store and Google Play |
| Blog or news section | None |
| Email signup form | None on any page |
| Lead capture and proof | |
| Call-to-action buttons | "Get Involved" and "Become a Partner" on the home page, both leading to the contact page |
| Enquiry form | One general form on the contact page, asking for name, email, phone, subject and message |
| Landing page per client type | None |
| Prices | Per-pickup plans published on the solution page |
| Client proof | Quotes from Fairmont Royal York and Sheridan College staff, a thank-you from a community partner, and partner logos on the home page |
| Search and measurement | |
| Page titles | "B12Give" on the home page, "Contact - B12Give" and similar elsewhere; none names the service or the city |
| Meta descriptions | On two of the six pages (contact and gallery) |
| Main heading (H1) | A worded H1 on the home, problem and solution pages; none on about, gallery or contact |
| Web analytics | Jetpack Stats, a WordPress page-view counter, loads on all six pages |
Some items cannot be seen from outside, so the audit does not mark them: written SMART goals and the metrics reported each month, whether enquiries are recorded by source, any email to existing clients, any paid social or offline advertising, and whether personas, a journey map or funnel stages are already in use. They are the questions for the first client meeting. An audit that marks them yes or no without asking is guessing.
Three findings shape the plan. First, the only way to enquire is one general form that asks a hotel and a caterer the same five questions, and asks neither how many sites it runs nor how much surplus it produces, so the purchase stage of the journey starts with a blank message box. Second, there is no blog and no page for any type of client, and the titles name the company rather than the service, so the site has little to rank for the terms a buyer searches. Third, Jetpack Stats counts visits; tracing an enquiry to the channel that produced it needs conversion tracking on the forms, and setting that up, or confirming it exists, is week one of the action plan.
Which Digital Marketing Tactics Does the Plan Use?
Social media on LinkedIn, Facebook and Instagram, on-page and off-page search engine optimization, a paid search campaign, email, and a content calendar, held together by a budget, an action plan and a measurement framework. Each tactic is tied back to a finding from the situation analysis rather than picked on its own.
Digital Marketing Tactics Against the Client's Needs
The client is a business-to-business operator, so the tactics below are weighted towards channels where a purchasing manager or a sustainability lead can be reached at work, and away from channels built for impulse consumer purchases. The sequence runs from organic social and search, through paid search, to the tools and the calendar that keep both running.
Social Media Plan
| Platform | Role in the plan | Content |
|---|---|---|
| Primary. Both personas are reachable here by job title, and this is where a peer referral becomes visible | Client diversion figures with permission, sustainability-reporting explainers, hiring posts, association event coverage | |
| Secondary. Community proof for the receiving side of the service, which supports the trust stage of the journey | Redistribution partner stories, volume milestones, local coverage | |
| Supporting. Visual evidence that the operation is real and professional | Short video of a pickup, kitchen and logistics footage, staff profiles |
The 7Cs of the Customer Interface
| Factor | Action |
|---|---|
| Context | Layout and design lead with the diversion figure and a single call to action, with the case studies one click away |
| Content | Client case studies, a sample diversion report, and short video of a collection |
| Commerce | The site takes enquiries and quote requests rather than transactions, which suits a contracted service |
| Community | Reachable from LinkedIn, Facebook, Instagram and email, with one consistent contact route |
| Connection | Linked from client sustainability pages, association directories and partner sites |
| Customization | Separate landing pages for hotels, caterers and education food services, because the three buy for different reasons |
| Communication | Two-way: consultation form, named account contact, and a monthly report the client can reply to |
SEO Table 1: On-Page Optimization
| SEO element | Current status | Recommendation | Priority | Timeline |
|---|---|---|---|---|
| Title tags | "B12Give" on the home page, "Contact - B12Give" and similar elsewhere; none names the service or the city | Lead each title with the term the buyer searches, such as surplus food collection Toronto or food waste diversion reporting | High | 1 week |
| Meta descriptions | On two of six pages (contact and gallery) | Write a snippet per page that names the service, the city and the next step | High | 1 week |
| URL structure | Short and readable (/solution/, /contact/), but none per service or client type | Readable URLs per service and per client type, consistent across the site | Medium | 1.5 weeks |
| Heading tags | No H1 on the about, gallery and contact pages; the home and solution pages carry several empty H1 tags beside the worded one | One H1 per page naming the service, H2s for the questions a buyer asks | High | 1 week |
| Landing pages | None per client type | One page each for hotels, caterers and education food services, each with a consultation form | High | 3 weeks |
SEO Table 2: Off-Page Optimization
Off-page signals cannot be read from the company's own site, so each row starts by recording a baseline: referring domains, posting frequency, review count and the state of the business profile.
| SEO element | Recommendation | Priority | Timeline |
|---|---|---|---|
| Backlinks | Earn links from client sustainability pages, hospitality associations and municipal waste-reduction resources | High | 3 weeks |
| Social media presence | A fixed weekly schedule on LinkedIn first, with the other two platforms following it | High | Ongoing |
| Review management | Ask existing clients for a review on Google and on relevant industry directories after the first quarterly report | Medium | Ongoing |
| Local SEO | Check and complete the Google Business Profile for the Toronto operation, with service areas and hours | High | Week 2 |
Mladenović et al. (2023) tested what predicts search visibility across 57 blood banks and found major predictors on both sides of the line: image alt text and robots settings on the page, backlinks and domain authority off it. That is why both tables above are funded rather than only the first.
PPC Plan
| Item | Detail |
|---|---|
| Brand | Be One to Give (B12Give) |
| Landing destination | b12give.ca, to the client-type landing pages built in the on-page work above |
| Purpose | Reach buyers who are already searching for organics disposal or waste-diversion reporting, during the months before the SEO work compounds |
| Target | Food suppliers, food manufacturers, hotels, contract caterers and food retailers in the Greater Toronto Area |
| Campaign structure | One search campaign per client type, with ad copy matching the landing page; no display or consumer social placements |
| Geography | Greater Toronto Area only |
| Cost | $450 for a one-month test, before any commitment to a larger budget |
| Success test | Cost per qualified enquiry below the twelve-month target set in the KPI table |
Digital Marketing Tools and What Each One Is For
Five tools carry the plan: paid search, search engine optimization, email, social media and a content calendar. Each is listed with what it is for and what it costs the company in effort, because a tools section that only lists benefits is not an argument.
Campaign slogan and purpose. The campaign line is "Reduce waste and balance food surplus to promote environmental affairs". Its job is to connect the two halves of the proposition, the cost of disposal and the social use of the food, in one sentence a buyer can repeat internally.
Paid search. The advertiser pays only when someone clicks, which makes it measurable from the first day and controllable against a fixed budget. Because the spend can be tied to the enquiries it produced, it can be stopped or moved. The cost is that it stops working the moment the budget stops.
Search engine optimization. SEO earns positions in the unpaid results, so a page that ranks keeps working without further spend. It is slow and cumulative, and it is the only channel in this plan whose cost per enquiry falls over time. The cost is the months before it pays, which the paid search test covers.
Email. Email carries the post-purchase stage: the monthly diversion report, the quarterly summary, and the renewal conversation. Lorente-Páramo, Hernández-García and Chaparro-Peláez (2021) tie each stage of the hierarchy of effects to a rate the industry already reports: attention to the open rate, interest to the click-through and retention rates, action to the conversion rate. Those four rates are how the email plan is measured. The cost is that a list has to exist first, and the audit found no signup form.
Social media. LinkedIn carries awareness and peer proof for both personas; the other platforms carry evidence that the operation is real. The cost is staff time every week, and the content calendar below is what keeps that time bounded.
Content calendar. The calendar exists so that the schedule survives a busy week. It also forces the plan to decide in advance what each post is for, which is the difference between a content plan and a habit.
Implementation and Action Plan
| Phase | Action | Owner | Timing | Success test |
|---|---|---|---|---|
| 1. Measurement | Add conversion tracking to the site's forms alongside the existing page-view counter, and define the funnel stages from the map above | Digital marketing specialist | Week 1 | Every stage of the journey has a recorded number |
| 2. Capture | Build the three client-type landing pages, each with a quote request that asks for sites and volume, and add an email signup | Specialist with the web developer | Weeks 2 to 4 | First quote request recorded from a landing page, with its source |
| 3. Visibility | On-page SEO work, Google Business Profile, first LinkedIn schedule | Specialist | Weeks 2 to 6 | Impressions for the target terms recorded and rising |
| 4. Paid test | One-month paid search test against the new landing pages | Specialist | Week 6 | Cost per qualified enquiry inside target |
| 5. Retention | Monthly diversion report by email, quarterly summary, referral ask | Account contact | Ongoing from month 2 | Renewal rate and referrals recorded |
Content Pillars and Calendar
Five content pillars carry the plan, and each maps to a stage of the buying process rather than to a topic the company finds interesting. Educate covers waste reduction and reporting, and serves the awareness stage. Culture and Trust serve consideration, through staff profiles, client reviews and named partners. Promotion serves purchase, through events and offers. Inspiration serves post-purchase, through the diverted-volume figures a client can share.
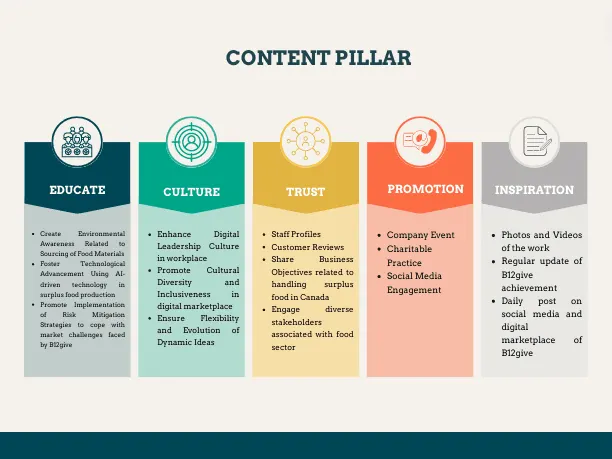
Posting runs four times a week across a three-month calendar. One representative week is shown below rather than all twelve, because the pattern repeats and the pillar rotation is the part that matters.
| Day | Channel | Pillar |
|---|---|---|
| Monday | Educate: one reporting or waste-reduction explainer | |
| Wednesday | LinkedIn and Instagram | Trust: client reference or a collection in progress |
| Thursday | Inspiration: monthly diversion figures to existing clients | |
| Friday | Facebook and Instagram | Culture or promotion: staff, partner organization, or an event |
Ethical and Legal Constraints
Three constraints shape what this campaign may claim and how it may collect data.
The first is food safety and handling. Surplus food moved to people is regulated at every step: storage temperature, traceability, allergen information and the certification of the people handling it. Nothing in the marketing plan may promise a collection window the operation cannot meet safely, because the cost of a food-safety incident lands on every client at once. Brooks et al. (2021) review food fraud and authenticity across the supply chain, including substitution and adulteration, and the relevant point for a redistribution business is that an additional link in the chain is an additional point where provenance has to be documented.
The second is the accuracy of the claim. Food insecurity has a defined meaning in Canada: Statistics Canada measures it as "the inability to acquire or consume an adequate diet quality or sufficient quantity of food in socially acceptable ways, or the uncertainty that one will be able to so" (Uppal, 2023). A campaign that implies a redistribution service resolves food insecurity is overclaiming, because the measure is financial and household-level. The honest claim, and the one the plan uses, is that the service diverts edible food that would otherwise be wasted.
The third is data. A business-to-business campaign collects work contact details, so consent, retention and unsubscribe handling have to be built into the email tool before the first campaign rather than added after it. That is an ethical constraint and a practical one, because a list built without consent cannot be used and has to be rebuilt.
Performance Evaluation and KPIs
Web Analytics
Web analytics is what tells the company whether the plan worked. Jetpack Stats already counts page views; what the plan needs on top is conversion tracking, so that each enquiry can be traced to the page and channel that produced it. Until that exists, most of the indicators below cannot be reported, which is why it is week one of the action plan rather than a later refinement. Verhaelen et al. (2021) make the case for linking indicators into a network so that the cause-and-effect path from an operational measure to a strategic one is visible. Here that path runs from a channel metric to an enquiry, and from an enquiry to a contract.
Defining Goals and Choosing Indicators
Each indicator below is tied to one of the three SMART objectives, with a stated target and a source, because an indicator with no target and no one who acts on it is only a statistic. Rodrigues, Godina and da Cruz (2021) show how far formal selection can go: an analytic network process narrowed 58 candidate indicators to nine for a case in the automotive tooling and die industry. That is more than a marketing plan of this size needs, but the principle carries over: choose few indicators, and choose each for the decision it informs.
| Stage | Indicator | Target | Source |
|---|---|---|---|
| Awareness | Impressions for the target search terms | Rising quarter on quarter from a week-one baseline | Search console and analytics |
| Awareness | LinkedIn follower growth among the two target job titles | Steady monthly growth, reported quarterly | LinkedIn page analytics |
| Acquisition | Qualified enquiries from the landing-page quote requests | Enough to support the 4 to 5% growth in contracted sites | Form submissions, tagged by landing page |
| Acquisition | Cost per qualified enquiry, paid and organic reported separately | Paid below the paid-search test threshold; organic falling over time | Ad platform plus analytics |
| Conversion | Enquiry to contracted client rate | Tracked from the first full quarter; no target until a baseline exists | Sales records |
| Retention | Annual renewal rate by client | Held or improved year on year | Contract records |
| Retention | Referrals from existing clients | At least one per quarter once the reporting routine is running | Enquiry source field |
| Efficiency | Kilometres driven per tonne collected | Down 2 to 3% within twelve months, per objective 2 | Dispatch records |
Two reporting rules apply to the whole table. Cost is reported alongside every volume measure, because volume on its own proves nothing. And organic and paid results are never combined, because they behave differently over time and combining them hides which one is working.
Budget
The total is $27,000 over twelve months, the sum of the ten lines in the chart above. Look at the shape of it rather than the size. Only $5,000, under a fifth, is media spend, and most of the rest buys capability: conversion tracking, landing pages, tools and the people to run them. That is the right shape for any campaign that starts before enquiries can be traced to their source, because media spend against an unmeasured funnel cannot be evaluated. The legal and software lines are also one-off, so the second-year budget for the same plan is materially smaller.
Be One to Give campaign budget by line, twelve months
Chart data
| Item | Value (CAD) |
|---|---|
| Online marketing spend | 5,000 CAD |
| Technical equipment | 3,500 CAD |
| Software installation | 3,000 CAD |
| Miscellaneous | 3,000 CAD |
| Digital marketing tools | 2,500 CAD |
| Training the marketing team | 2,500 CAD |
| Digital marketing specialist fees | 2,500 CAD |
| Legal fees | 2,000 CAD |
| Website and application work | 1,500 CAD |
| Market analyst fees | 1,500 CAD |
Conclusion and Recommendations
The case for this campaign rests on two national figures and one audit finding. Second Harvest and Value Chain Management International valued Canada's avoidable lost and wasted food at $49.46 billion, of which 11.2 million tonnes is edible and could be redirected to people (Second Harvest, 2019). Statistics Canada reported that 24.0% of Canadians, about 9.8 million people, lived in households reporting some form of food insecurity in 2024 (Statistics Canada, 2026). The audit of Be One to Give's website on 24 September 2026 found a company addressing that problem with a clear offer, published prices and named clients, but with one general contact form, no page for any single type of client, and titles that do not name the service.
The plan closes that gap in a deliberate order: measurement first, capture second, visibility third, paid media fourth, retention continuously. It is scoped to one city, two buyer roles and four channels, at a cost of $27,000 over twelve months, with three SMART objectives and an indicator against each. What it does not do is spend on reach before it can measure what reach produces.
Recommendations
- Add conversion tracking in week one. Jetpack Stats counts visits; the plan needs enquiries counted by source, and nothing else in it can be evaluated until they are.
- Build three client-type landing pages, each with a quote request. The site's one general contact form asks every buyer the same five questions and none about sites or volume.
- Make LinkedIn the primary channel. Both personas are reachable there by job title, and peer proof between hospitality operators is the strongest signal in this market.
- Lead with the reporting, not with the cause. The buyer's problem is disposal cost and a sustainability commitment they have to evidence. The diversion report is the product.
- Keep the paid search test small and separate. One month, one city, reported apart from organic, with a stated cost-per-enquiry threshold before any larger commitment.
- Do not claim the service solves food insecurity. The measured definition is financial and household-level. Claim what is true and evidenced: edible food diverted, and the volume documented.
Need a digital marketing plan, campaign report or case study written to a brief like this one? Message us on WhatsApp with the client, the word count and the deadline.
References
- Agriculture and Agri-Food Canada, 2026. Overview of Canada's agriculture and agri-food sector. https://agriculture.canada.ca/en/sector/overview [Accessed 24 September 2026]
- B12Give, 2026. Be One to Give: home, about, problem, solution, gallery and contact pages. https://www.b12give.ca/ [Accessed 24 September 2026]
- Brooks, C., Parr, L., Smith, J.M., Buchanan, D., Snioch, D. and Hebishy, E., 2021. A review of food fraud and food authenticity across the food supply chain, with an examination of the impact of the COVID-19 pandemic and Brexit on the food industry. Food Control, 130, 108171. https://doi.org/10.1016/j.foodcont.2021.108171
- Ciulli, F., Kolk, A. and Boe-Lillegraven, S., 2020. Circularity brokers: digital platform organizations and waste recovery in food supply chains. Journal of Business Ethics, 167, pp.299-331. https://doi.org/10.1007/s10551-019-04160-5
- Lorente-Páramo, Á.J., Hernández-García, Á. and Chaparro-Peláez, J., 2021. Modelling e-mail marketing effectiveness: an approach based on the theory of hierarchy-of-effects. Cuadernos de Gestión, 21(1), pp.19-27. https://doi.org/10.5295/cdg.191094ah
- Mladenović, D., Rajapakse, A., Kožuljević, N. and Shukla, Y., 2023. Search engine optimization (SEO) for digital marketers: exploring determinants of online search visibility for blood bank service. Online Information Review, 47(4), pp.661-679. https://doi.org/10.1108/OIR-05-2022-0276
- Rodrigues, D., Godina, R. and da Cruz, P.E., 2021. Key performance indicators selection through an analytic network process model for tooling and die industry. Sustainability, 13(24), 13777. https://doi.org/10.3390/su132413777
- Second Harvest and Value Chain Management International, 2019. The avoidable crisis of food waste: the roadmap. Toronto: Second Harvest. Web page dated 7 October 2021. https://www.secondharvest.ca/research/avoidable-crisis [Accessed 24 September 2026]
- Second Harvest and Value Chain Management International, 2024. The avoidable crisis of food waste: update. Toronto: Second Harvest, 22 October 2024. https://www.secondharvest.ca/research/avoidable-crisis-updated [Accessed 24 September 2026]
- Statistics Canada, 2022. North American Industry Classification System (NAICS) Canada 2022 Version 1.0: introduction. https://www.statcan.gc.ca/en/subjects/standard/naics/2022/v1/introduction [Accessed 24 September 2026]
- Statistics Canada, 2026. Canadian Income Survey, 2024. The Daily, 29 April 2026. https://www150.statcan.gc.ca/n1/daily-quotidien/260429/dq260429a-eng.htm
- Uppal, S., 2023. Food insecurity among Canadian families. Insights on Canadian Society, Statistics Canada, 14 November 2023. https://www150.statcan.gc.ca/n1/pub/75-006-x/2023001/article/00013-eng.htm
- Verhaelen, B., Mayer, F., Peukert, S. and Lanza, G., 2021. A comprehensive KPI network for the performance measurement and management in global production networks. Production Engineering, 15, pp.635-650. https://doi.org/10.1007/s11740-021-01041-7
Also read: marketing strategy of H&M, a detailed analysis, Zara PESTLE analysis and VRIO, BYD energy marketing strategy, and Milton Friedman's shareholder theory on corporate social responsibility.
Frequently Asked Questions
How do food delivery apps use digital marketing?
They compete on three fronts: paid acquisition through app-install and search campaigns, organic visibility through local SEO and app store listings, and retention through push notifications, email and loyalty offers. Because switching costs are close to zero, most of the spend goes on keeping existing users rather than finding new ones.
What is a persona in a marketing plan?
A persona is a short profile of one representative customer: their situation, what they are trying to do, what stops them, what they can spend, and where they can be reached. It exists to make targeting decisions concrete. A persona with no purchasing behaviour in it is decoration, and markers spot the difference.
What KPIs should a digital marketing campaign track?
Match the metric to the objective. Awareness campaigns track reach, impressions and share of voice. Acquisition tracks cost per lead, cost per acquisition and conversion rate. Retention tracks repeat order rate, churn and customer lifetime value. Report cost alongside volume, because volume on its own proves nothing.
What is the difference between SEO and PPC?
SEO earns positions in the unpaid results by making a site worth ranking; it is slow, cumulative and free at the point of click. PPC buys positions in an auction; it is immediate, controllable and stops the moment the budget stops. Most plans need both, with PPC covering the period before SEO compounds.